
Category: For physicians

  • Dr. Gurpreet Singh Padda beside the title card reading Your Brain Was Built for Ketones, Not Sugar, The Starved Brain, Chapter 2

    Fasting Insulin Screening: The Gate on the Brain’s Second Fuel

    Your Brain Was Built for Ketones, Not Sugar | The Starved Brain, Chapter 2

    Fasting Insulin Screening: The Gate on the Brain’s Second Fuel

    Fasting insulin screening finds insulin resistance years before glucose moves: in Whitehall II, insulin sensitivity was already lower across the 13 years before a diabetes diagnosis, while fasting glucose accelerated only in the final 3. An elevated result is worth acting on; a normal one is not a clearance.

    The brain has no gate for ketones. The liver does, and insulin controls it. That makes fasting insulin, read as a number, one of the earliest metabolic signals a practice can capture and document.

    Fasting insulin screening is still unusual in adult primary care, where the metabolic workup is organized around glucose and HbA1c. Chapter 2 of The Starved Brain, presented in the video Your Brain Was Built for Ketones, Not Sugar, argues from physiology that the human brain was built to use fat-derived fuel. For the clinician, that argument has a concrete screening consequence: whether a patient can reach that second fuel at all is decided by insulin, and insulin moves years before glucose does.

    Measura [Cardiometabolic and Autonomic Health Analysis] is a measurement service. It reports to the ordering physician, who owns interpretation and management.

    How does insulin control the brain’s access to ketones?

    Cerebral ketone uptake is concentration-driven. The Sherbrooke group describes proportionality over at least 0.02–12 mM, while glucose entry is regulated by neuronal demand. When ketones were infused to 2.16 mM in healthy adults, cerebral ketone uptake rose from 1.11 to 5.60 µmol/100 g/min and glucose metabolism fell from 25.8 to 17.2 despite adequate glucose supply. The brain accepts whatever ketone load the circulation presents.

    The limiting step is hepatic. Ketogenesis requires low insulin, and in nutritional ketosis the small amount of insulin still present is what keeps production regulated. A hyperinsulinemic patient therefore has a closed liver regardless of what the brain could use. That reframes insulin resistance from a diabetes-risk variable into a fuel-access variable, with the brain as a downstream stakeholder.

    Why is glucose a late marker of insulin resistance?

    Whitehall II followed 6,538 British civil servants. The 505 who progressed to diabetes had insulin sensitivity 34.2% lower and compensatory secretion 10.4% higher across the entire 13 years before diagnosis, while fasting glucose accelerated only in the final 3. A screening strategy anchored on glucose finds these patients a decade late.

    Fasting insulin has its own limit. In the Kraft database, just over half of 4,185 people with normal glucose tolerance were hyperinsulinemic only by dynamic pattern, and the authors concluded fasting insulin had limited value in finding them. The error runs in one direction: a single fasting value under-detects hyperinsulinemia; it does not over-call it. An elevated result is therefore worth acting on, and a normal one is not a clearance.

    What fasting insulin level is too high?

    In 965 patients from one endocrine practice, mostly white, obese and female, a fasting insulin above 9.0 µIU/mL identified 80% of prediabetes. Dr. Padda’s clinic threshold is a fasting insulin above 10 µIU/mL, his own cutoff rather than a guideline, and in his patients that is where damage is already under way. LP-IR, a 0–100 score from six NMR lipoprotein measures, correlates r = 0.51 with HOMA-IR in 4,972 MESA participants; in 5,314 MESA adults followed 7.7 years, the top quartile carried a hazard ratio of 3.28 for diabetes, 1.93 after adjustment for HOMA-IR and glucose. Three of the four authors who built the score worked for its manufacturer, and no study has yet tied it to brain volume. The tier is prospective cohort data plus single-practice thresholds, which is enough to screen on and not enough to call settled.

    Two biological drivers keep these patients invisible: compensatory hyperinsulinemia holding glucose in range, and hepatic fuel switching that never gets exercised. The third is behavioral and economic. Carbohydrate supplied 50.5% of energy for U.S. adults in the 2016 NHANES cycle, so the average patient never leaves the fed state long enough for anyone to observe whether the switch still works.

    How should ketone results be read alongside insulin?

    Patients who pursue carbohydrate restriction will bring ketone values. The frame that prevents errors is insulin presence, not ketone magnitude. Nutritional ketosis runs roughly 0.5–3 mmol/L with normal glucose and pH. The Joint British Diabetes Societies definitions put the emergency beyond 3.0 mmol/L with acidosis, and ketoacidosis can reach 20 mmol/L. The 2022 guideline added a section on SGLT2 inhibitors because they raise the risk of ketoacidosis at normal glucose. In that population a normal glucose is the reason to check ketones, and any plan to restrict carbohydrate belongs with the prescriber before it starts.

    Pregnancy needs its own caution. The cohort behind the guidance to avoid ketones, 223 women of whom eighty-four percent had diabetes, found weak inverse correlations with offspring scores, and a 2021 review called the evidence conflicting and inconsistent. Harm is unproven and so is safety; the physiology described in the book is not a pregnancy recommendation.

    Dr. Padda applied the same discipline to his own material, correcting an early claim that newborns run substantially on ketones once the human tracer data showed a smaller share than the rat studies suggested. Screening deserves that standard too.

    Who should get a fasting insulin test, and what does a result change?

    • Adults with central adiposity or other features of insulin resistance whose glucose and HbA1c are still normal.
    • Patients planning significant carbohydrate restriction, especially those on insulin or SGLT2 inhibitors.
    • Patients with cognitive complaints, where brain fuel supply is part of the differential.

    A documented elevated insulin changes follow-up: it justifies a shorter repeat interval, prompts bioimpedance body composition to separate fat gain from muscle loss, supports indirect calorimetry to replace an estimated resting metabolic rate with a measured one, and, where memory or attention is a concern, a scored cognitive assessment baseline. Selection triggers are laid out in selection criteria, and the rationale in clinical rationale.

    Workflow and documentation

    Standing orders let staff route qualifying patients into laboratory panels without a separate decision at every visit. Results need to land where they will be seen again; getting diagnostic results into the chart covers the mechanics. Serial values support chronic care follow-up and HEDIS and value-based care documentation, described in HEDIS and value-based care. The full study set, with every limit named, is in the Chapter 2 companion to The Starved Brain by Dr. Gurpreet Singh Padda, MD, MBA, MHP; the prior installment covers pairing cognitive screening with metabolic data.

    Frequently asked questions

    Why screen fasting insulin when HbA1c is normal?

    Because insulin compensates for years before glucose fails. In Whitehall II, people who later developed diabetes had lower insulin sensitivity and higher secretion across all 13 years before diagnosis, while glucose accelerated only in the last 3. HbA1c records the failure of compensation; insulin records the compensation itself. The glucose-late timeline and what it means for dementia screening is in insulin resistance and dementia screening.

    What fasting insulin value should prompt follow-up?

    Published data put a useful line near 9.0 µIU/mL, which identified 80% of prediabetes in one practice of 965 patients. Dr. Padda’s clinic uses above 10 µIU/mL as its own cutoff. Because a single fasting value under-detects hyperinsulinemia, an elevated result deserves action and a normal one is not reassurance. See interpreting the report.

    How should ketone values be read in patients on SGLT2 inhibitors?

    Always with glucose, and never with a normal glucose taken as reassurance, since these agents carry a risk of ketoacidosis at normal blood sugar. Emergency definitions begin above 3.0 mmol/L with acidosis. Any carbohydrate restriction in these patients should be discussed with the prescriber before it begins. The ketone ranges and the SGLT2 exception are laid out for patients in ketosis vs ketoacidosis.

    Which measurements pair best with an elevated insulin result?

    Body composition shows whether the metabolic strain is accompanied by fat gain, sarcopenic wasting or both. Measured resting metabolic rate replaces a formula estimate. A cognitive baseline adds the brain side where symptoms warrant it. Together they turn one laboratory value into a trackable profile. Why a measured rate replaces the formula is covered in measured versus estimated metabolic rate.

    How do results get back to the ordering physician?

    Results are reported to the ordering physician, who retains interpretation and management. The practical work is making sure values are filed as discrete, searchable data so serial insulin results can be trended rather than rediscovered at each visit. See getting results into the record for the options.

    What does a fasting insulin level tell you?

    It shows how hard the pancreas is working to hold blood sugar in range, a strain that glucose and HbA1c do not reveal until late. High insulin also keeps the liver from making ketones, so the number decides whether the brain can reach its second fuel. A single fasting value can miss high insulin but does not falsely flag it, so an elevated result is worth acting on.

    Why don’t doctors routinely check fasting insulin?

    Adult primary care builds the metabolic workup around glucose and HbA1c, so fasting insulin is still an unusual order. A single fasting value also has a known limit: in one large database, just over half of people with normal glucose tolerance showed high insulin only in a dynamic pattern. That limit runs one way, though. It misses some cases; it does not over-call them.

    Is a fasting insulin test the same as an A1c test?

    No. HbA1c records the failure of compensation: it moves late, once the pancreas can no longer hold glucose in range. Fasting insulin records the compensation itself, meaning how hard the pancreas is working while glucose and HbA1c still look normal. In Whitehall II, insulin sensitivity was already lower across the 13 years before a diabetes diagnosis, while fasting glucose accelerated only in the final 3.

    Screen the years before glucose moves

    Learn how the Measura protocol adds metabolic, body-composition and resting energy measurement to a practice’s existing screening workflow.

    4477 Woodson Rd, Suite 201, St. Louis, MO 63134. Monday to Friday, 9:00 a.m. to 5:00 p.m. Please do not send symptoms, diagnoses or images through a web form — a website form is not a secure medical channel. Send your name and number and we will call you back.

    References

    • Tabák, A. G., Jokela, M., Akbaraly, T. N., Brunner, E. J., Kivimäki, M., & Witte, D. R. (2009). Trajectories of glycaemia, insulin sensitivity, and insulin secretion before diagnosis of type 2 diabetes: An analysis from the Whitehall II study. The Lancet, 373(9682), 2215-2221. https://doi.org/10.1016/S0140-6736(09)60619-X
    • Crofts, C., Schofield, G., Zinn, C., Wheldon, M., & Kraft, J. (2016). Identifying hyperinsulinaemia in the absence of impaired glucose tolerance: An examination of the Kraft database. Diabetes Research and Clinical Practice, 118, 50-57. https://doi.org/10.1016/j.diabres.2016.06.007
    • Johnson, J. L., Duick, D. S., Chui, M. A., & Aldasouqi, S. A. (2010). Identifying prediabetes using fasting insulin levels. Endocrine Practice, 16(1), 47-52. https://doi.org/10.4158/EP09031.OR
    • Mackey, R. H., Mora, S., Bertoni, A. G., Wassel, C. L., Carnethon, M. R., Sibley, C. T., & Goff, D. C. (2015). Lipoprotein particles and incident type 2 diabetes in the Multi-Ethnic Study of Atherosclerosis. Diabetes Care, 38(4), 628-636. https://doi.org/10.2337/dc14-0645
    • Shalaurova, I., Connelly, M. A., Garvey, W. T., & Otvos, J. D. (2014). Lipoprotein insulin resistance index: A lipoprotein particle-derived measure of insulin resistance. Metabolic Syndrome and Related Disorders, 12(8), 422-429. https://doi.org/10.1089/met.2014.0050
    • Cunnane, S. C., Courchesne-Loyer, A., Vandenberghe, C., St-Pierre, V., Fortier, M., Hennebelle, M., Croteau, E., Bocti, C., Fulop, T., & Castellano, C.-A. (2016). Can ketones help rescue brain fuel supply in later life? Implications for cognitive health during aging and the treatment of Alzheimer’s disease. Frontiers in Molecular Neuroscience, 9, Article 53. https://doi.org/10.3389/fnmol.2016.00053
    • Hasselbalch, S. G., Madsen, P. L., Hageman, L. P., Olsen, K. S., Justesen, N., Holm, S., & Paulson, O. B. (1996). Changes in cerebral blood flow and carbohydrate metabolism during acute hyperketonemia. American Journal of Physiology, 270(5 Pt 1), E746–E751. https://doi.org/10.1152/ajpendo.1996.270.5.E746
    • Rizzo, T., Metzger, B. E., Burns, W. J., & Burns, K. (1991). Correlations between antepartum maternal metabolism and intelligence of offspring. New England Journal of Medicine, 325(13), 911–916. https://doi.org/10.1056/NEJM199109263251303
    • Tanner, H. L., Dekker Nitert, M., Callaway, L. K., & Barrett, H. L. (2021). Ketones in pregnancy: Why is it considered necessary to avoid them and what is the evidence behind their perceived risk? Diabetes Care, 44(1), 280–289. https://doi.org/10.2337/dc20-2008
    • Dhatariya, K. K., & Joint British Diabetes Societies for Inpatient Care (2022). The management of diabetic ketoacidosis in adults—An updated guideline from the Joint British Diabetes Society for Inpatient Care. Diabetic Medicine, 39(6), Article e14788. https://doi.org/10.1111/dme.14788
    Related reading

  • Dr. Gurpreet Singh Padda beside the title card reading Overfed and Starving, The Starved Brain, Chapter 1

    Cognitive Screening in Primary Care: Add the Metabolic Picture

    Overfed and Starving | The Starved Brain, Chapter 1

    Cognitive Screening in Primary Care: Add the Metabolic Picture

    Cognitive screening in primary care should not stop at the score. A falling result in an insulin-resistant adult is a supply signal, and pairing it with metabolic and nutrient measurements lets the decline be interpreted rather than merely recorded.

    A slipping cognitive score in an overweight patient is usually filed under early aging. The evidence supports reading it as a supply problem that can be measured before anyone calls it normal.

    Cognitive screening in primary care usually stops at the score: pass, borderline, or refer. The patient who most needs a second look rarely triggers either path. He is in his late fifties, insulin resistant, carrying central weight, eating three meals a day plus snacks, and his result is a few points lower than it was three years ago. Chapter 1 of The Starved Brain, presented in the video Overfed and Starving, makes the case that this presentation is not an exception but the default, and that the decline is partly a materials problem hiding under an energy surplus.

    Measura [Cardiometabolic and Autonomic Health Analysis] is a testing service. It does not treat; it gives the ordering physician measurements that sit next to the cognitive result so the decline can be interpreted rather than merely recorded.

    Is age-related brain atrophy really normal?

    Radiology reports use normal age-related atrophy every day, and most of us have repeated it to patients. Dr. Padda counts himself among the clinicians who said it for years. The problem is the reference population. Pooling 56 longitudinal MRI studies of 2,211 healthy people, whole-brain loss begins near 0.2% a year at 35 and passes 0.5% a year after 60. Healthy there means without diagnosed disease; nobody in those cohorts was screened for insulin resistance or nutrient status. The curve we compare patients against is a curve of the unmeasured.

    Bone went through the same relabeling. Density loss with age was once considered simply what happens to older women, until its dependence on vitamin D, calcium, protein and loading was established and it became osteoporosis, something clinicians screen for and manage. Brain volume has not had that conversation at scale.

    What drives cognitive decline in an insulin-resistant patient?

    The first is cerebral energy supply. In twelve cognitively normal APOE4 heterozygotes with a mean age of 30.7, regional glucose metabolism was 8.0–10.5% lower in Alzheimer-vulnerable cortex, with cognition unchanged. In 77 cognitively normal adults followed a mean 7.2 years, baseline hippocampal glucose metabolism predicted decline to Alzheimer’s disease with 81% accuracy, about 8 years ahead, though on only six converters. In 2,439 Framingham Offspring adults, fasting insulin tracked smaller total brain volume with diabetes excluded, while HbA1c did not.

    The second is the methylation pathway. In 107 cognitively normal older adults scanned annually, the bottom tertile of plasma B12, below 308 pmol/L, carried an odds ratio of 6.17 for being in the fastest-losing tertile, with no one deficient by the 150 pmol/L cutoff. The gradient runs inside the reference range, which is precisely where a serum B12 is read as reassuring.

    The third is structural and economic: a food supply that delivers cheap refined energy while displacing the densest sources of B12, choline and DHA, and a visit model that places cognition, weight and laboratory values in separate silos with separate owners. No single driver explains the slope. Together they describe the patient in the exam room.

    The evidence tier, stated plainly

    VITACOG randomized 271 adults over 70 with mild cognitive impairment to folic acid, B12 and B6 or placebo; annual atrophy measured 0.76% with the vitamins versus 1.08% with placebo, a 29.6% slowing, with the benefit concentrated above a baseline homocysteine of 13.0 µmol/L and absent at or below 9.5. The Cochrane review of five trials in 879 people found probably little or no cognitive effect, called the atrophy finding a single study needing replication, and the trial leads hold patents on B vitamins for this use. Association is consistent across cohorts; the causal atrophy signal rests on one research group, and replication is the honest ask.

    Those trials also enrolled almost no one with diabetes; the VITACOG imaging subgroup included fourteen. The overfed, insulin-resistant patient is missing from the evidence base, which is an argument for measuring him, not for waiting.

    Who should get cognitive screening in primary care?

    Metabolic dysfunction is the population baseline, not a niche. Metabolically healthy U.S. adults fell from under 12.2% on NHANES 2009–2016 to under 7% on the tighter post-2021 criteria. In the Padda clinic population the figure is under 3% overall and under 1% of chronic pain patients. Both clinic numbers come with a caveat: practice-reported figures from our own population, not trial outcomes, and individual results vary; even so, the direction is unmistakable. Reasonable triggers for pairing a cognitive assessment with metabolic measurement:

    • Central adiposity, prediabetes or known insulin resistance with any downward change in a cognitive score.
    • A report describing age-appropriate atrophy in a patient never screened metabolically.
    • Long-term metformin use, which roughly doubles B12 deficiency risk (RR 2.09 across 31 studies).
    • New falls, near-falls or balance complaints alongside memory or attention concerns.

    The full criteria are in selection criteria.

    What should a falling cognitive score change?

    A cognitive result read alone produces a referral or a watchful wait. Paired, it changes the next order. Cognitive assessment establishes a scored baseline that later results are compared against. Laboratory panels frame the metabolic picture, and the ordering physician can extend them to B12 with methylmalonic acid or holotranscobalamin, homocysteine, fasting insulin as a number, 25-hydroxyvitamin D and the omega-3 index. Bioimpedance body composition separates fat mass from sarcopenic wasting, which BMI cannot. When cognition and gait slip together, vestibular and balance testing belongs in the same encounter, because a fall is often the first catastrophic event of a declining brain; the pairing is detailed in cognitive assessment and fall prevention.

    The management decisions stay with the treating physician: repeat interval, nutrition and activity counseling, and whether a result warrants specialty referral. How each value is framed is covered in interpreting the report.

    How does paired screening fit into a primary care workflow?

    Pairing works only if it does not depend on someone remembering. Standing orders let staff initiate the protocol when a trigger is present, and making screening reproducible walks through how that is structured. The annual wellness visit already carries a look at cognition, so it is the natural anchor; see annual wellness visit integration. A documented baseline and follow-up also support MIPS and HEDIS reporting as quality and documentation work. The study-level evidence, including every limit named above, is in the Chapter 1 companion to The Starved Brain by Dr. Gurpreet Singh Padda, MD, MBA, MHP, and the patient-facing version of this argument is written for your patients. The Lancet Commission’s modifiable risks, turned into what a visit can actually measure, are in modifiable risk factors for dementia.

    Frequently asked questions

    Which patients benefit most from pairing cognitive and metabolic testing?

    Adults with insulin resistance, prediabetes or central adiposity whose cognitive scores are drifting down, patients on long-term metformin, and anyone whose imaging report calls atrophy age-appropriate without a metabolic workup. Add balance concerns and the case strengthens. These patients were largely absent from the trials, so measurement is the only way to characterize them. See clinical rationale.

    Does a serum B12 inside the reference range rule out a contribution to atrophy?

    No. In 107 cognitively normal older adults, the fastest brain-volume losers clustered in the bottom tertile of B12, below 308 pmol/L, and none were deficient by the 150 pmol/L cutoff. Functional markers such as methylmalonic acid or holotranscobalamin, plus homocysteine, give a more useful read than serum B12 alone. How to order those functional markers in practice is covered in screening beyond serum B12.

    How strong is the evidence that correcting B-vitamin status slows atrophy?

    Moderate for association, thin for causation. One randomized trial found atrophy 29.6% slower on B vitamins, strongest when homocysteine was above 13.0 µmol/L, while a Cochrane review of five trials found probably little cognitive effect. The work comes largely from one patent-holding group. The practice position is to measure and treat the individual. Why timing decides whether B vitamins help is set out in B vitamins in mild cognitive impairment.

    Where does this fit in an existing visit structure?

    The annual wellness visit is the obvious anchor because cognition is already reviewed there. Standing orders can route patients who meet selection triggers into metabolic, body-composition and balance measurement without a separate decision each time, and results return to the ordering physician for management. See staffing and workflow.

    Why add balance testing to a cognitive workup?

    Declining cognition and declining balance travel together, and a fall can turn a slow decline into an abrupt loss of independence. Measuring both in one encounter gives the physician a fuller risk picture and a clearer reason to act on the metabolic findings. See vestibular and balance testing for what the test measures.

    Pair the score with the terrain

    See how the Measura protocol places cognitive assessment alongside metabolic and body-composition measurement inside an existing primary care workflow.

    4477 Woodson Rd, Suite 201, St. Louis, MO 63134. Monday to Friday, 9:00 a.m. to 5:00 p.m. Please do not send symptoms, diagnoses or images through a web form — a website form is not a secure medical channel. Send your name and number and we will call you back.

    References

    • Hedman, A. M., van Haren, N. E. M., Schnack, H. G., Kahn, R. S., & Hulshoff Pol, H. E. (2012). Human brain changes across the life span: A review of 56 longitudinal magnetic resonance imaging studies. Human Brain Mapping, 33(8), 1987–2002. https://doi.org/10.1002/hbm.21334
    • Mosconi, L., De Santi, S., Li, J., Tsui, W. H., Li, Y., Boppana, M., Laska, E., Rusinek, H., & de Leon, M. J. (2008). Hippocampal hypometabolism predicts cognitive decline from normal aging. Neurobiology of Aging, 29(5), 676–692. https://doi.org/10.1016/j.neurobiolaging.2006.12.008
    • Tan, Z. S., Beiser, A. S., Fox, C. S., Au, R., Himali, J. J., Debette, S., DeCarli, C., Vasan, R. S., Wolf, P. A., & Seshadri, S. (2011). Association of metabolic dysregulation with volumetric brain magnetic resonance imaging and cognitive markers of subclinical brain aging in middle-aged adults: The Framingham Offspring Study. Diabetes Care, 34(8), 1766–1770. https://doi.org/10.2337/dc11-0308
    • Vogiatzoglou, A., Refsum, H., Johnston, C., Smith, S. M., Bradley, K. M., de Jager, C., Budge, M. M., & Smith, A. D. (2008). Vitamin B12 status and rate of brain volume loss in community-dwelling elderly. Neurology, 71(11), 826–832. https://doi.org/10.1212/01.wnl.0000325581.26991.f2
    • Smith, A. D., Smith, S. M., de Jager, C. A., Whitbread, P., Johnston, C., Agacinski, G., Oulhaj, A., Bradley, K. M., Jacoby, R., & Refsum, H. (2010). Homocysteine-lowering by B vitamins slows the rate of accelerated brain atrophy in mild cognitive impairment: A randomized controlled trial. PLoS ONE, 5(9), e12244. https://doi.org/10.1371/journal.pone.0012244
    • McCleery, J., Abraham, R. P., Denton, D. A., Rutjes, A. W. S., Chong, L.-Y., Al-Assaf, A. S., Griffith, D. J., Rafeeq, S., Yaman, H., Malik, M. A., Di Nisio, M., Martínez, G., Vernooij, R. W. M., & Tabet, N. (2018). Vitamin and mineral supplementation for preventing dementia or delaying cognitive decline in people with mild cognitive impairment. Cochrane Database of Systematic Reviews, 2018(11), CD011905. https://doi.org/10.1002/14651858.CD011905.pub2
    • Yang, W., Cai, X., Wu, H., & Ji, L. (2019). Associations between metformin use and vitamin B12 levels, anemia, and neuropathy in patients with diabetes: A meta-analysis. Journal of Diabetes, 11(9), 729–743. https://doi.org/10.1111/1753-0407.12900
    • Reiman, E. M., Chen, K., Alexander, G. E., Caselli, R. J., Bandy, D., Osborne, D., Saunders, A. M., & Hardy, J. (2004). Functional brain abnormalities in young adults at genetic risk for late-onset Alzheimer’s dementia. Proceedings of the National Academy of Sciences of the United States of America, 101(1), 284–289. https://doi.org/10.1073/pnas.2635903100

    Related reading

  • A healthcare professional operates a centrifuge machine in a laboratory, ensuring sterile medical procedures.

    Standing Orders: Making Screening Reproducible

    Standing orders: making screening reproducible

    A standing order for screening is a written rule, applied at intake, that decides which patients are tested. The order selects the patient; a clinician selects the panel.

    Selection by clinical impression cannot be audited and is not reproducible. A written rule applied at intake turns “who should we test” into something two staff members answer the same way.

    What information does a screening standing order collect?

    All of this is gathered before any testing decision is made, because the decision rule depends on it.

    • Age and sex; height, weight and body mass index; abdominal girth, with thresholds above 102 cm in men and 88 cm in women; blood pressure, heart rate and oxygen saturation.
    • Symptom review: nerve pain, joint pain, numbness or burning, dizziness or unsteadiness, claudication or reduced walking distance, and any recent infective symptoms.
    • Personal history of cancer, type 2 diabetes, angina or transient ischemic attack; hypertension and thyroid disease, treated or not; antidepressant, anxiety or post-traumatic stress treatment; addiction risk or current opioid use.
    • Social history: alcohol, tobacco, substance use.
    • Family history: diabetes, cardiovascular disease, hypertension, stroke, cancer.

    Which patients does the standing order select for testing?

    Testing is indicated where any one of these is true: over 50 with at least one cardiovascular risk factor; over 70 regardless; hypertension, treated or untreated; body mass index above 30, or abdominal girth above the thresholds at any body mass index; current or former tobacco use; diabetes or impaired glucose tolerance; or any symptom from the neuropathic, autonomic, claudication or unsteadiness clusters at any age.

    Three or more metabolic syndrome traits present at intake is a separate trigger and is worth recording explicitly, because it is a defensible and auditable reason for the assessment.

    Why is a written rule better than clinical judgment for screening?

    1. It is reproducible. Two staff members applying the same rule select the same patients. Two clinicians applying impression do not.
    2. It is auditable. Under any quality program, evidence that a defined activity was applied across a population is worth more than evidence that individual decisions were made well.
    3. It removes the selection bias that hides disease. The patients who most need measuring are frequently the least likely to raise it, because their symptoms are painless and they have already adapted to them.
    4. It protects clinic time. Staff apply the rule without interrupting a clinician for every decision.

    Should a standing order test every patient for everything?

    It must not order everything for everyone. The suite is modular, and the studies indicated by burning feet are not the studies indicated by unsteadiness. The standing order selects the patient; a clinician selects the panel. How a testing plan is chosen.

    How do you audit a standing order?

    Count patients who met the criteria against patients who were actually assessed, in both directions, over a defined period. The gap in the first direction tells you whether the rule is being applied. The gap in the second tells you whether testing is happening outside the rule. Both are worth knowing and neither is visible without counting.

    Settle scope of practice first

    Who may apply a standing order, and what level of supervision applies to each study, depends on the study, the setting, state scope-of-practice rules and payer policy. Settle it in writing before implementation rather than discovering it afterwards. Supervision and staffing.

    Frequently asked questions

    What is a standing order in healthcare?

    A standing order is a written rule that staff apply at intake to decide which patients get tested. It replaces clinical impression with criteria that two staff members will apply the same way. The order picks the patient; a clinician still picks which tests to run. Staff can apply it without stopping a clinician for every decision, and the practice can audit it later.

    What is an example of a standing order?

    The screening rule in this protocol is one. A patient qualifies if any one of these is true: over 50 with at least one cardiovascular risk factor; over 70; high blood pressure, treated or not; a body mass index above 30, or a waist above 102 cm in men or 88 cm in women; current or former tobacco use; diabetes or impaired glucose tolerance; or nerve, balance, walking-distance or autonomic symptoms at any age.

    Who can carry out a standing order?

    Trained staff apply the rule at intake, which is what keeps screening from depending on a clinician remembering to ask. Exactly who may apply it, and how much supervision each test needs, depends on the test, the setting, state scope-of-practice rules and payer policy. Settle those questions in writing before the order goes live, not after a problem turns up.

    Related reading

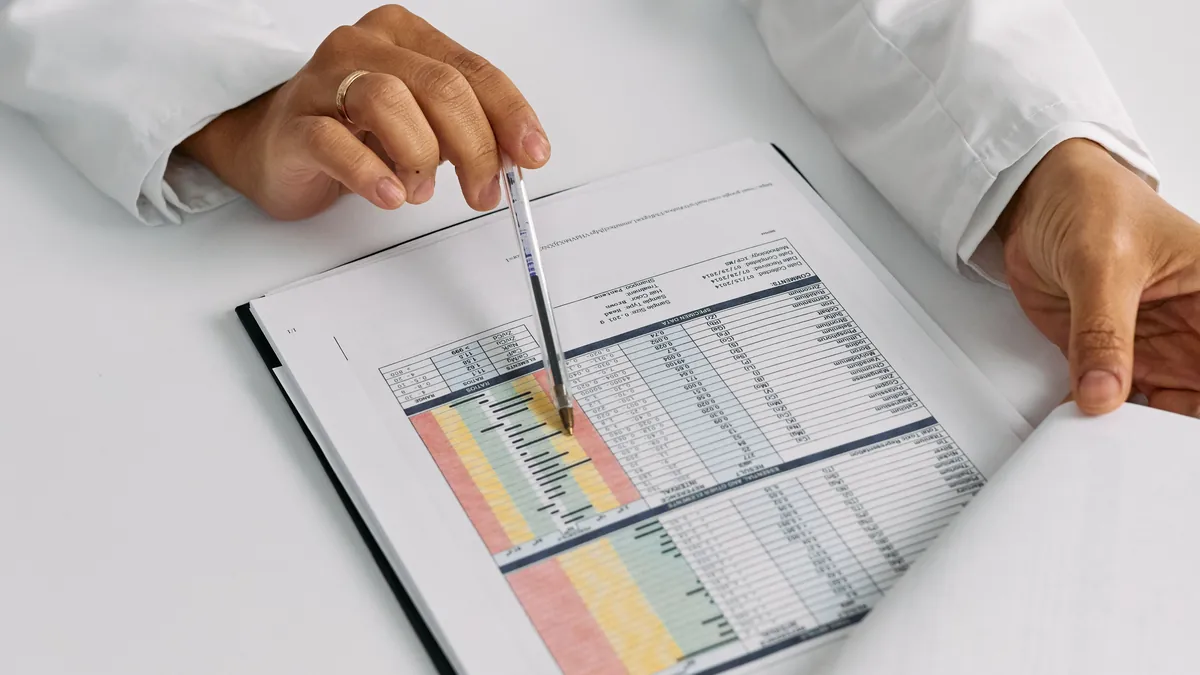
  • A clinician points a pen at a color-coded table of patient results

    Quality Measures That Cardiometabolic Testing Supports

    Quality measures this testing supports

    Cardiometabolic testing supports the documentation domains behind body mass index follow-up, blood pressure, diabetes care (glycemic control, foot examination and nephropathy), tobacco screening, falls risk, cognitive assessment and medication reconciliation.

    Most of what these assessments produce is documentation a practice is already required to generate. The difference is that it is generated as measurement rather than as attestation.

    This describes clinical documentation domains, not specific measure identifiers, which change every performance year. Confirm current specifications with the CMS Quality Payment Program and with the relevant plan. Nothing here is billing guidance.

    Which quality measures does cardiometabolic testing support?

    DomainWhat the assessment contributes
    Body mass index screening and follow-upHeight, weight, waist and body composition recorded with a documented follow-up plan attached
    Blood pressure documentation and controlSeated measurement, plus positional measurement where indicated
    Diabetes care — glycemic controlGlycemic markers from the laboratory panel, including insulin alongside glucose
    Diabetes care — foot examinationObjective sudomotor and vascular foot data rather than an inspection note
    Diabetes care — nephropathyRenal markers from the laboratory panel
    Tobacco use screening and interventionRecorded at intake, and clinically load-bearing because smoking is the strongest single association with peripheral artery disease
    Falls risk assessment and plan of careVestibular, oculomotor, orthostatic and peripheral sensory measurement rather than a recall question
    Cognitive assessmentA structured screening instrument with a recorded, comparable baseline
    Medication reconciliationA complete medication and supplement list is a precondition for interpreting the testing, so it happens anyway
    Clinical documentation domains supported by the assessment suite.

    Why is a measured reading better than attestation?

    A domain satisfied by a checkbox and a domain satisfied by a recorded instrument reading count the same and are not the same thing. The second is auditable, comparable year over year, and produces a number the patient can be shown. As programs move toward outcome measurement, building the habit on measured data is the durable choice.

    The falls domain is the clearest example

    The conventional screening question is whether the patient has fallen in the past year. It depends entirely on recall and on willingness to admit it. The measured alternative does not: in a national survey, 35.4% of US adults aged 40 and older had vestibular dysfunction detectable on a simple standing-balance test, and symptomatic individuals carried twelve times the odds of falling. Falls remain the leading cause of injury death after 65, with 38,742 unintentional fall deaths recorded in 2021.

    How do you make quality data usable?

    Three habits: record the conditions of measurement alongside the numbers, use the same instrument and technique every time, and capture a short fixed set of values discretely rather than only as a filed document. Getting results into the chart.

    Frequently asked questions

    Which MIPS quality measures does this testing help document?

    This testing supports documentation domains rather than specific measure identifiers, because the identifiers change every performance year. The domains are body mass index follow-up, blood pressure, diabetes care (glycemic control, foot examination and nephropathy), tobacco screening, falls risk, cognitive assessment and medication reconciliation. Confirm current specifications with the CMS Quality Payment Program and the relevant plan.

    Does a checkbox count the same as a measured reading?

    For the program, a domain satisfied by a checkbox and one satisfied by a recorded instrument reading count the same. They are not the same thing. The measured reading is auditable, comparable year over year and gives the patient a number they can be shown, which matters more as programs move toward outcome measurement.

    How can falls risk be assessed without relying on memory?

    The usual screening question asks whether the patient has fallen in the past year, which depends on recall and on willingness to admit it. The measured alternative uses vestibular, oculomotor, orthostatic and peripheral sensory testing instead, so the result does not depend on what the patient remembers or chooses to report.

    Why does tobacco screening matter for vascular testing?

    Tobacco use is recorded at the intake visit, and it is clinically load-bearing, because smoking is the strongest single association with peripheral artery disease. The same entry that satisfies the tobacco screening domain also shapes how the vascular results are read.

    References

    • Agrawal Y, Carey JP, Della Santina CC, Schubert MC, Minor LB. Disorders of balance and vestibular function in US adults: data from the National Health and Nutrition Examination Survey, 2001–2004. Archives of Internal Medicine. 2009;169(10):938–944. doi:10.1001/archinternmed.2009.66
    • Kakara R, Bergen G, Burns E, Stevens M. Nonfatal and Fatal Falls Among Adults Aged ≥65 Years — United States, 2020–2021. MMWR Morbidity and Mortality Weekly Report. 2023;72(35):938–943. doi:10.15585/mmwr.mm7235a1

    Related reading

  • Video thumbnail for "What Defines a Great Tester?" with Dr. Gurpreet Singh Padda, MD, MBA, MHP

    What Makes a Good Vascular and Autonomic Tester

    What Defines a Great Tester?

    What makes a good tester

    A good vascular and autonomic tester keeps six habits: identical positioning every time, a strict rest period, preparation checked out loud and recorded, properly prepared skin, maneuvers coached rather than recited, and implausible readings caught in the room.

    Nearly every false abnormality in this suite is procedural. The person performing the studies is the largest single determinant of whether the numbers mean anything.

    How do you perform vascular and autonomic tests accurately?

    1. Identical positioning, every time

    Cuff height relative to the heart changes a pressure reading. So does the angle of the bed and whether a leg is externally rotated. Fix the position, write it down, and do not vary it between patients or between visits.

    2. The rest period is not negotiable

    Vascular and autonomic measurements taken on someone who has just walked in from the parking lot are not the measurements anyone wanted. Ten minutes supine, quiet, in a temperature-stable room. Cold extremities alone can render an optical waveform uninterpretable.

    3. Check the preparation out loud, and record the answers

    Fasting, caffeine, nicotine, alcohol the night before, sleep, and medication timing. Ask every one, every time. Record what the patient actually says, not what the protocol required. A reading annotated “had coffee at 7” is interpretable; the same reading unannotated is noise.

    4. Prepare the skin properly

    For sudomotor plates, lotion, residue, moisture and heavy callus all move the reading. For optical sensors, nail polish and artificial nails degrade the signal. Neither takes long to check and both are easy to skip.

    5. Coach the maneuvers rather than reciting them

    This is the biggest one. Deep timed breathing at six breaths a minute, a controlled exhale against resistance, and standing briskly from supine are all performed badly by most people on the first attempt. A badly performed maneuver produces a trace that looks exactly like autonomic failure. Demonstrate it, give a practice attempt, use a manometer for the exhale rather than instruction alone, and repeat the maneuver rather than reporting a bad one.

    6. Recognize an implausible reading in the room

    An ankle-brachial index of 1.6 is not a healthy artery, it is an incompressible one. A resting energy expenditure that is wildly out of keeping with the patient’s lean mass is probably a mask leak. Noticing at the bedside saves an interpretation that was never going to be valid.

    Does the tester’s credential matter?

    Which credential the tester holds matters less than whether the six habits above are reproducible. What is legally required varies by study, by setting and by state, and should be settled separately and in writing. Supervision and staffing.

    How do you know your test results are reliable?

    Have testers measure each other, repeatedly, on the same day. If repeat measurements on the same person a few minutes apart do not agree, no result from that room is comparable to anything. That check takes an afternoon and it is the single most valuable thing to do before testing patients.

    Frequently asked questions

    How is an ABI test performed accurately?

    The patient is placed in the same position every time, with cuff height relative to the heart, bed angle and leg position fixed and written down. Then comes ten minutes lying down, quiet, in a temperature-stable room. A reading taken on someone who just walked in from the parking lot is not the reading anyone wanted.

    What can throw off an ABI or autonomic test?

    Most false abnormalities are procedural. Caffeine, nicotine, alcohol the night before, sleep, fasting and medication timing all matter, so the tester asks and records each one. Cold hands or feet can make an optical waveform unreadable, lotion or moisture moves a sudomotor reading, and nail polish or artificial nails degrade the optical signal.

    What does a very high ABI reading mean?

    An ankle-brachial index of 1.6 is not a healthy artery. It is an incompressible one. A good tester recognizes a reading like that in the room, before the patient leaves, because catching it at the bedside saves an interpretation that was never going to be valid.

    Can a badly done breathing test look like autonomic failure?

    Yes. Deep timed breathing, a controlled exhale against resistance and standing briskly from lying down are done badly by most people on the first try, and a poorly performed maneuver produces a trace that looks exactly like autonomic failure. The tester demonstrates it, allows a practice attempt, uses a manometer for the exhale and repeats a bad maneuver.

    Related reading

  • Video thumbnail for "How Measura Integrates With an EMR" with Dr. Gurpreet Singh Padda, MD, MBA, MHP

    Getting Diagnostic Results Into the Chart

    How Measura Integrates With an EMR

    Getting diagnostic results into the chart

    Diagnostic results reach the chart at three levels: a PDF report filed as a document, a short fixed set of values captured as structured observations, or interface-level exchange with no manual entry. Discrete capture is the right first target, because it lets results be trended, graphed and queried, and it can be started this week.

    A report filed as a scanned image satisfies a documentation requirement and answers no question you can ask across a panel.

    How do diagnostic results get into the EMR?

    1. Document delivery. The report arrives as a PDF and is filed. Visible to a clinician reading that chart, invisible to everything else. Fast to set up, and where most practices stop.
    2. Discrete result capture. A short fixed set of values is entered as structured observations. Now they can be trended, graphed and queried.
    3. Interface-level exchange. Results flow in as structured messages with no manual entry. Highest effort, and the only level that scales to a whole panel.

    Why is discrete result capture the right first step?

    Level one is not enough, because the entire clinical argument for repeat measurement rests on comparison, and a PDF cannot be compared with anything by a computer. Level three is the correct destination and is a project with its own timeline and its own budget conversation. Level two captures most of the value for a fraction of the effort, and it can be started this week.

    Which test results should be recorded in the EMR?

    • Ankle-brachial index, left and right.
    • Toe-brachial index, left and right.
    • Sudomotor conductance, hands and feet.
    • Heart rate variability summary index.
    • Orthostatic blood pressure change.
    • Resting energy expenditure.
    • Lean body mass and fat mass.
    • Cognitive screening score.
    • Conditions of measurement — fasting state, caffeine, nicotine, time of day, medication timing.

    That last one is the field most often omitted and the one that makes every other field comparable. Without it a trend is a guess.

    How do you keep charted results usable?

    1. Choose the fields once and never change them. A field quietly redefined destroys the trend it was created for.
    2. Have the person who performed the study enter the values, at the time of the study. If it falls to the reviewing clinician it happens inconsistently.
    3. Keep the narrative report as well. Discrete values do not carry waveform morphology or the interpreting clinician’s reasoning.

    How does discrete data help quality reporting?

    Several of these values feed the clinical domains that quality programs consume — body mass index and follow-up, blood pressure, diabetes care, falls risk and cognitive assessment. Data captured discretely is auditable and comparable year over year in a way that an attestation is not. MIPS and quality reporting.

    Frequently asked questions

    What does EMR integration mean for diagnostic test results?

    It means results reach the chart in a form the record can use. There are three levels: a PDF report filed as a document, a short fixed set of values entered as structured observations, and interface-level exchange, where results flow in as structured messages with no manual entry. Only the last two let results be trended, graphed and queried.

    Is a scanned PDF report in the chart enough?

    No. A filed PDF satisfies a documentation requirement, and a clinician reading that one chart can see it, but it is invisible to everything else. The clinical case for repeat measurement rests on comparison, and a computer cannot compare a PDF with anything. Keep the narrative report, and capture the key values as discrete data as well.

    Who should enter test results into the chart?

    The person who performed the study, at the time of the study. When entry falls to the reviewing clinician, it happens inconsistently. Choose the fields once and never change them, because a field that is quietly redefined destroys the trend it was created for.

    Why record fasting, caffeine and time of day with the results?

    Because the conditions of measurement are what make every other field comparable. Fasting state, caffeine, nicotine, time of day and medication timing all belong in the record. It is the field most often left out, and without it a trend is a guess.

    Related reading

  • Video thumbnail for "Must a Physician Be Present?" with Dr. Gurpreet Singh Padda, MD, MBA, MHP

    Supervision and Staffing for In-Office Testing

    Must a Physician Be Present?

    Supervision and staffing for in-office testing

    The honest answer to “must a physician be present” is that it depends on the study and the setting, and that it should be settled in writing before the first patient rather than discovered afterward.

    What determines supervision requirements for in-office testing?

    Supervision requirements for diagnostic studies performed in an office are governed by a combination of the specific study, the setting it is performed in, state scope-of-practice rules for the person performing it, and payer policy. Those four do not always align, and none of them is a question a website can answer for your practice.

    What this page can do is set out how to answer it once, properly, and what to write down.

    What should a practice decide before in-office testing starts?

    1. Which studies are being performed? The answer differs between a cuff-based vascular study, an autonomic battery with challenge maneuvers, and a vestibular battery.
    2. Who is performing each one, and what does state scope of practice permit that person to do unsupervised?
    3. What level of supervision applies — presence in the office suite, immediate availability, or direct presence in the room?
    4. Who interprets, and is interpretation documented as a separate act from acquisition?
    5. What happens if the patient becomes symptomatic during standing or positional testing, and who is available?

    Write the answers down, date them, and review them when anything changes. A verbal understanding is not a policy.

    Which testing tasks need a physician?

    Independent of the regulatory question, there is a practical one: which parts genuinely require a physician’s time?

    • Physician tasks: selecting the panel for the presenting question, interpreting results against the history and medication list, and the conversation about what follows.
    • Trained staff tasks: everything else — intake, vitals, preparation checks, acquisition, coaching the maneuvers, recording the conditions.

    Designing the workflow so those three physician tasks are the only physician-consuming steps is what makes the program viable in a busy clinic. Staffing and workflow.

    Why does the tester matter more than the equipment?

    Almost every source of false abnormality in this suite is procedural: an inadequate rest period, a cuff at the wrong height, skin that was not prepared, or a breathing maneuver that was described rather than coached. Whoever performs these studies is the largest single determinant of whether the results mean anything. What makes a good tester.

    Frequently asked questions

    Does a physician have to be present during in-office testing?

    It depends on the study and the setting. Supervision rules for in-office diagnostic studies come from the specific study, where it is performed, state scope-of-practice rules for the person performing it, and payer policy, and those four do not always line up. Settle the answer in writing, study by study, before the first patient is tested.

    What are the levels of supervision for an in-office test?

    The level can mean presence in the office suite, immediate availability, or direct presence in the room. Which one applies depends on the study being performed, who performs it and what their scope of practice allows, and payer policy. Write down the level that applies to each study, date it, and review it whenever anything changes.

    Who should interpret in-office test results?

    Interpretation is a physician task: reading the results against the patient’s history and medication list, then having the conversation about what follows. Document interpretation as a separate act from acquisition. Trained staff handle the rest, including intake, vitals, preparation checks, acquisition, coaching the maneuvers and recording the conditions.

    Related reading